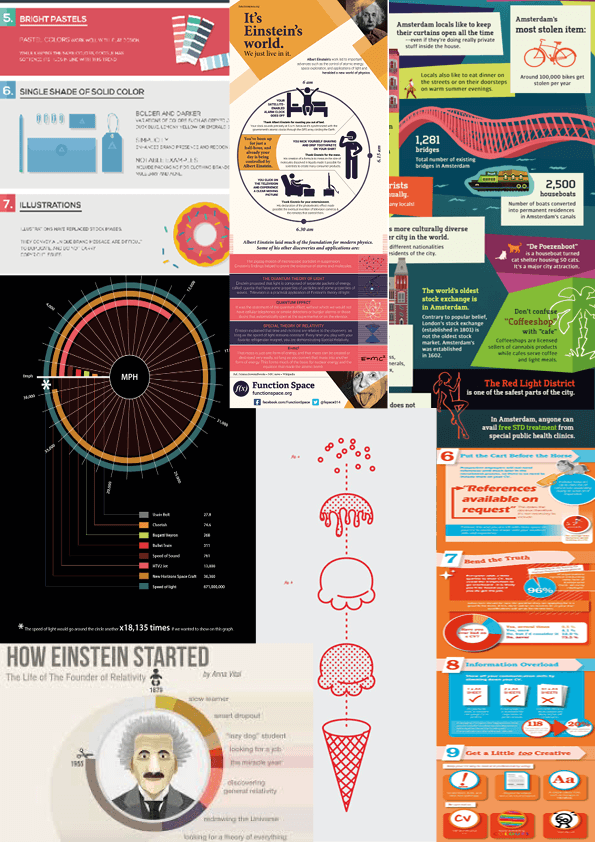
After being given our brief on creating a website / mobile device prototype and an A2 poster with infographics, I decided to go back in ‘Pinterest’ to have a look at some examples to inspire and influence my ideas. Most of them I found that a lot involved numbers/ percentages and graphs. This panicked me slightly as I couldn’t find any numbers/percentages that related to Einstein and his theory of relativity. However, after a discussion with Chris and a little more research, I found that you don’t need to convey ‘percentage’ data to show information through graphics. I made a mood board of my favourite ones.